News ·
September 2026: Still slipping, just more gently
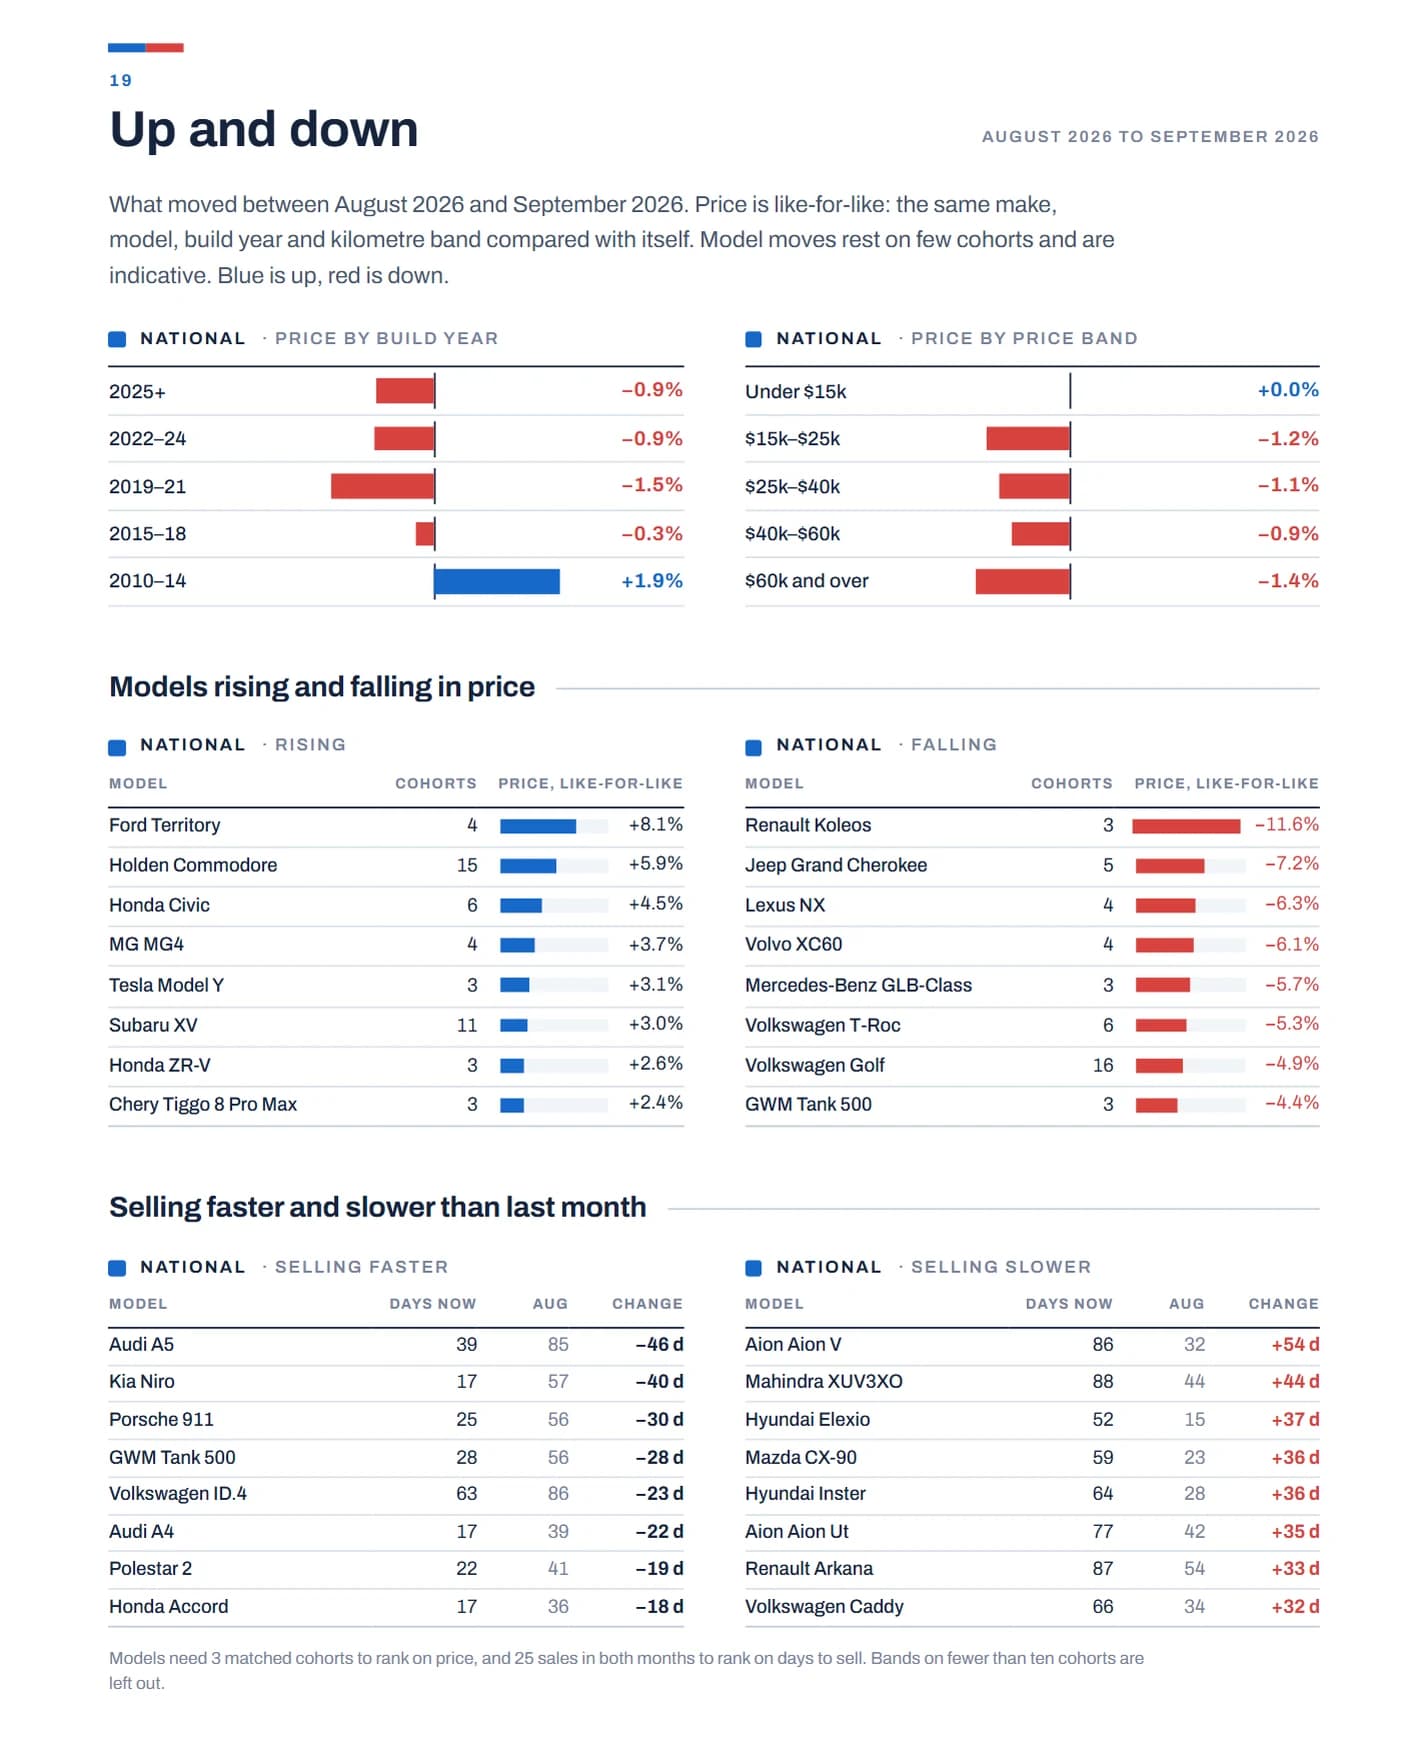
Like-for-like prices eased 0.7% in September, a softer fall than August's 1.3%, and the share of cars sold below their first price held steady at 39.3%. Cars that sold at their first price went in 18 days, against 64 after a cut.
September was another month of prices easing, just not as hard as August.
Across 3,192 dealer rooftops, 70,583 sales were observed. The median used car went for $28,490, against $28,888 in August, and took 28 days to sell, against 26. Like-for-like, the same make, model, build year and kilometre band sold for 0.7% less in September than in August. On the same dealers, August's fall was 1.3%.
Discounting held steady
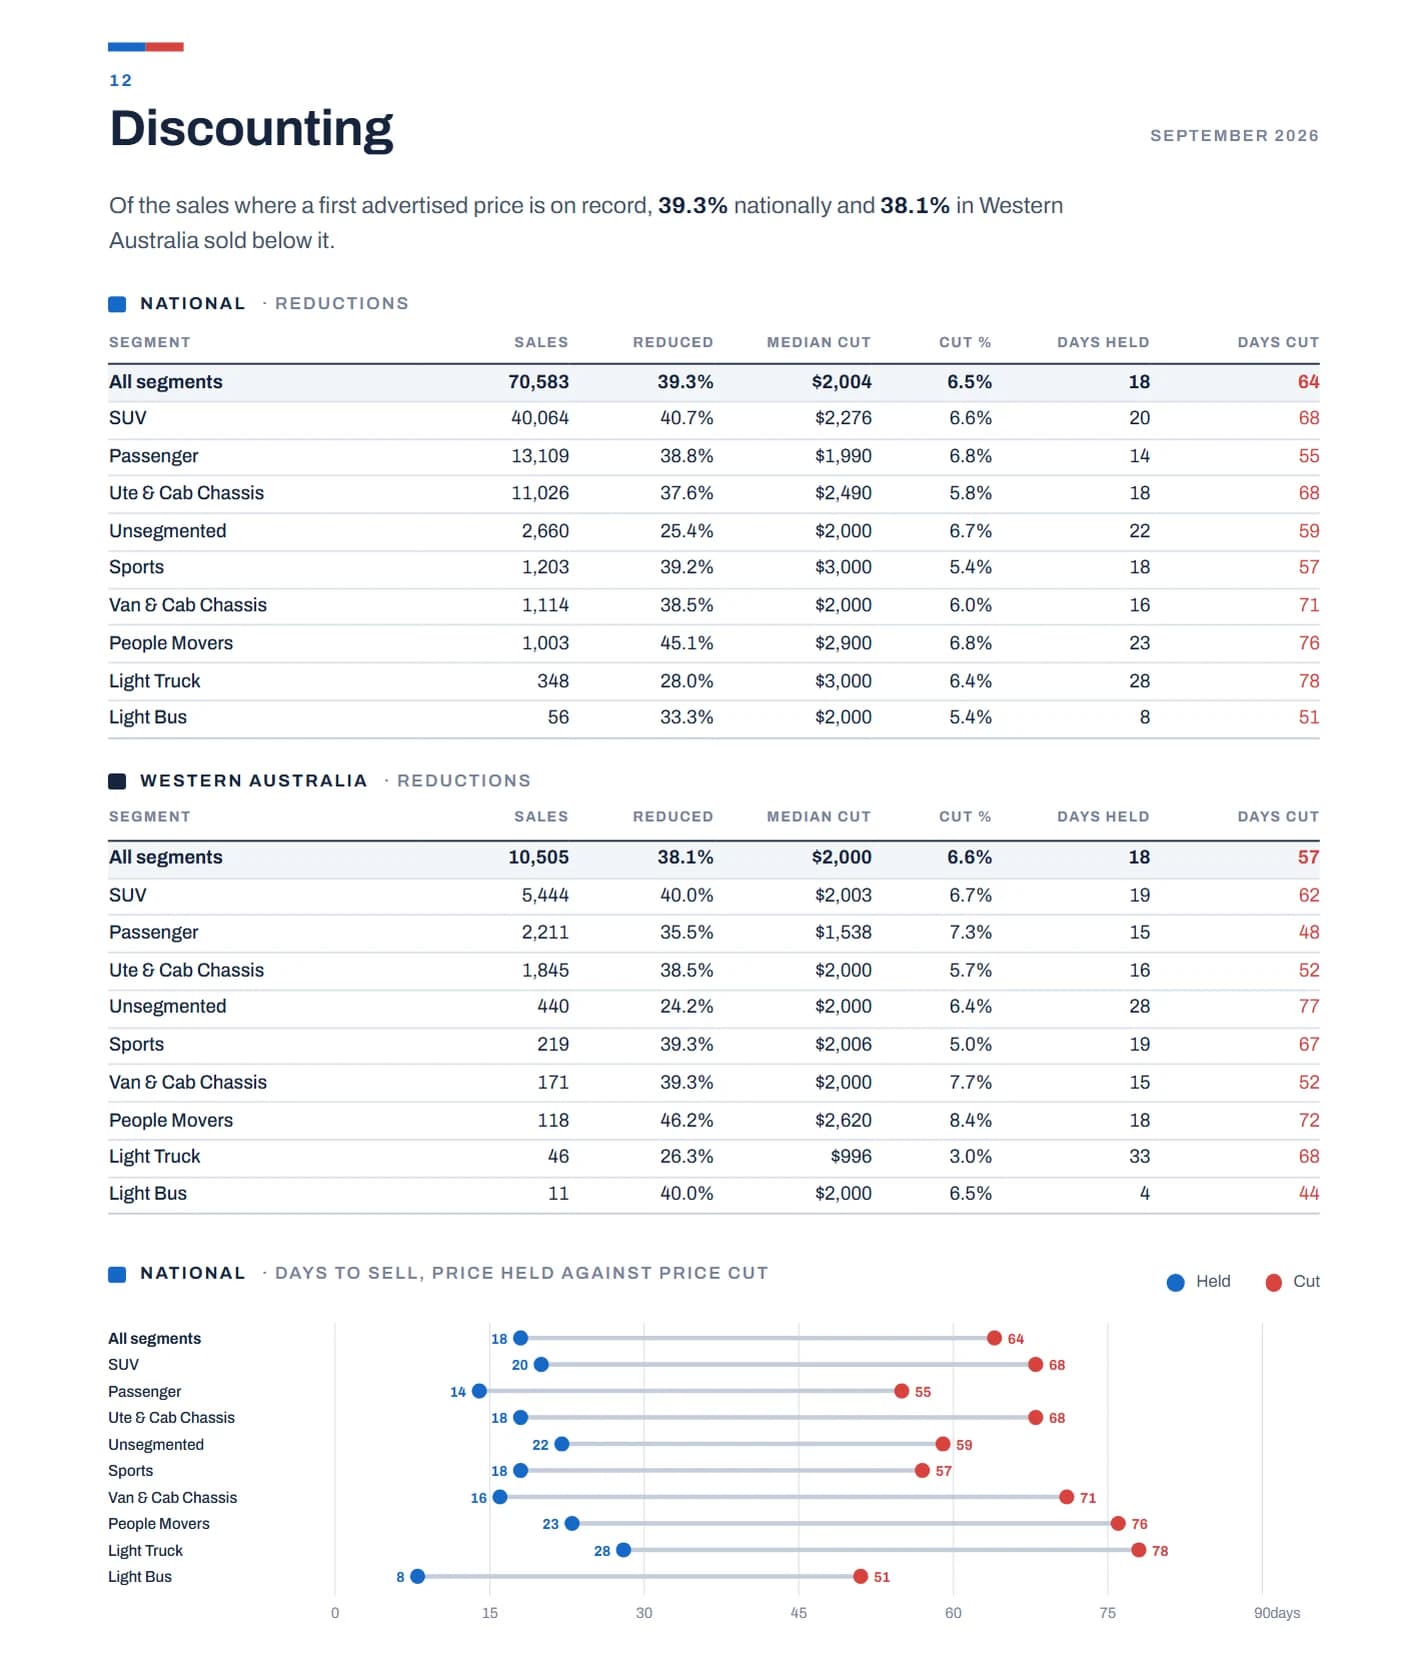
39.3% of cars sold in September went for less than the first price we saw them advertised at, against 39.1% in August on the same dealers. The median cut was $2,004, about 6.5% off the sticker.
A car that sold at its first price cleared in a median 18 days. A car that was repriced took 64, more than three times as long.
Near-new took longer
Demonstrator and near-new stock took 46 days to clear nationally against 28 for used, at a median $46,990 a unit. It made up 37% of sales.
Fastest and slowest
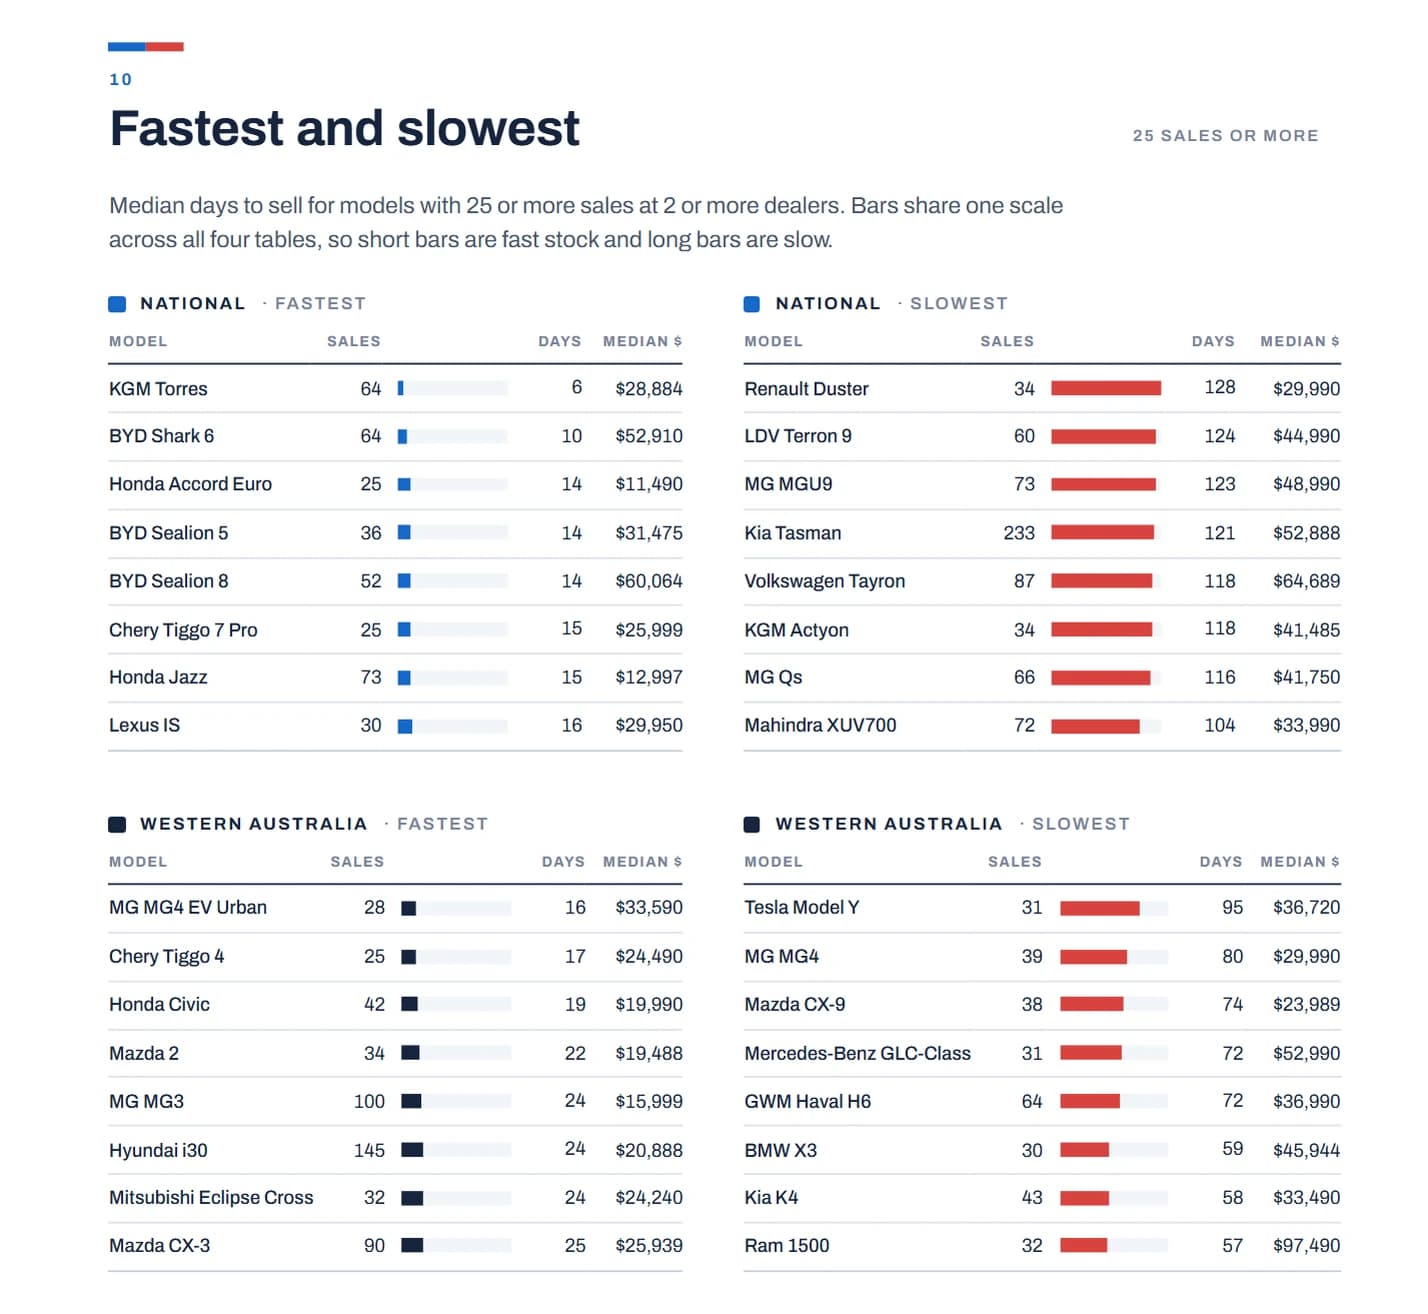
The quickest were new nameplates: KGM Torres at 6 days, BYD Shark 6 at 10 and BYD Sealion 8 at 14.
The slowest were new nameplates too. Renault Duster sat 128 days, LDV Terron 9 124, MG MGU9 123. Kia Tasman took 121 days across 233 sales. KGM Actyon, MG QS and VW Tayron all ran past 110.
Electric share up again
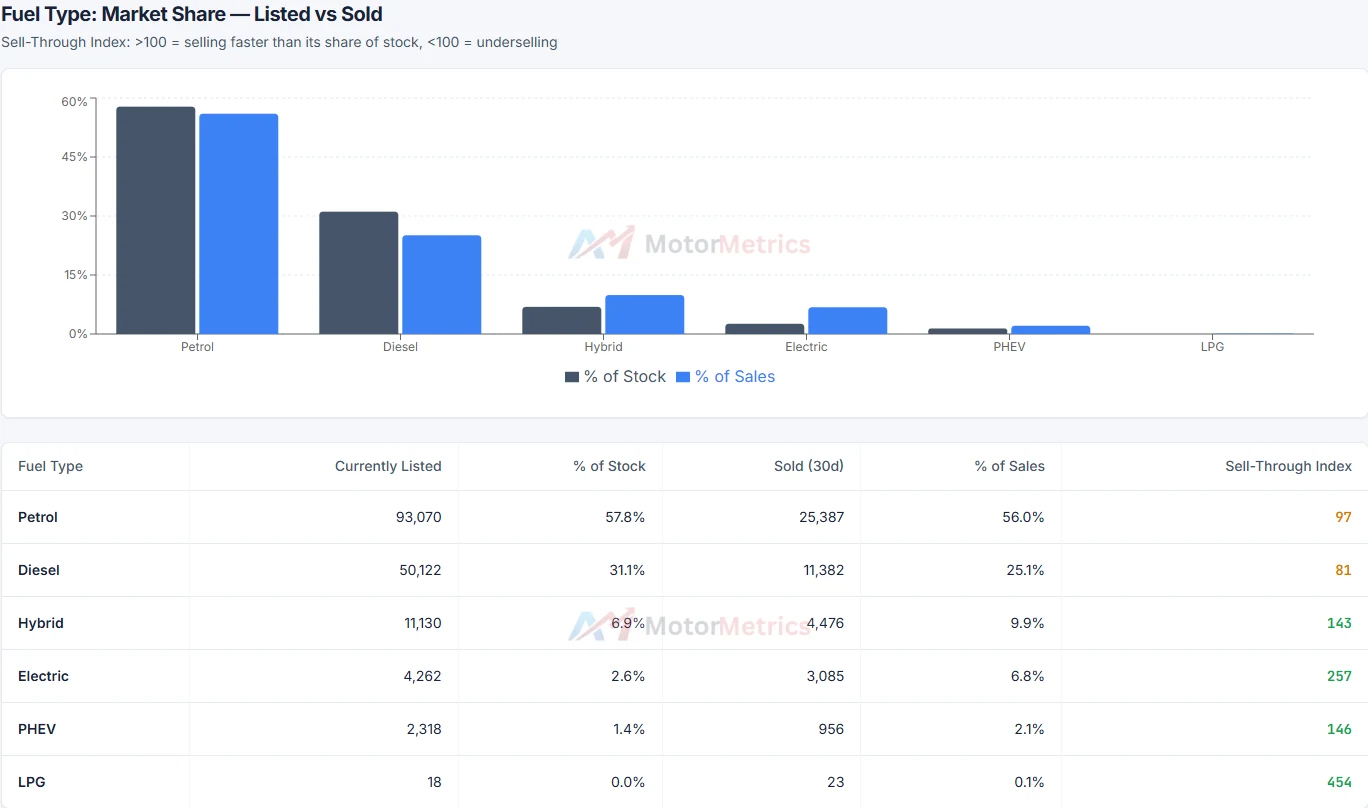
Electric vehicles took 6.5% of sales in September, up from 5.3% in August on the same dealers, and sold in a median 31 days. Most electric sales are demo and near-new stock, so that figure isn't a like-for-like comparison with petrol. Hybrids took another 8.9% and plug-in hybrids 3.4%. Together that's nearly one dealer sale in five.
Makes and models
Toyota held 12.1% of sales, down 0.6 points on August, and Mazda gave back 0.7. MG and Subaru each picked up 0.3. Ranger was the best seller again at 2,819 sales, and Hilux and RAV4 were the quickest of the big names at 21 and 24 days.
Pre-2010 cars sold in a median 24 days at a median $8,990.
West of the Nullarbor (God's Country)
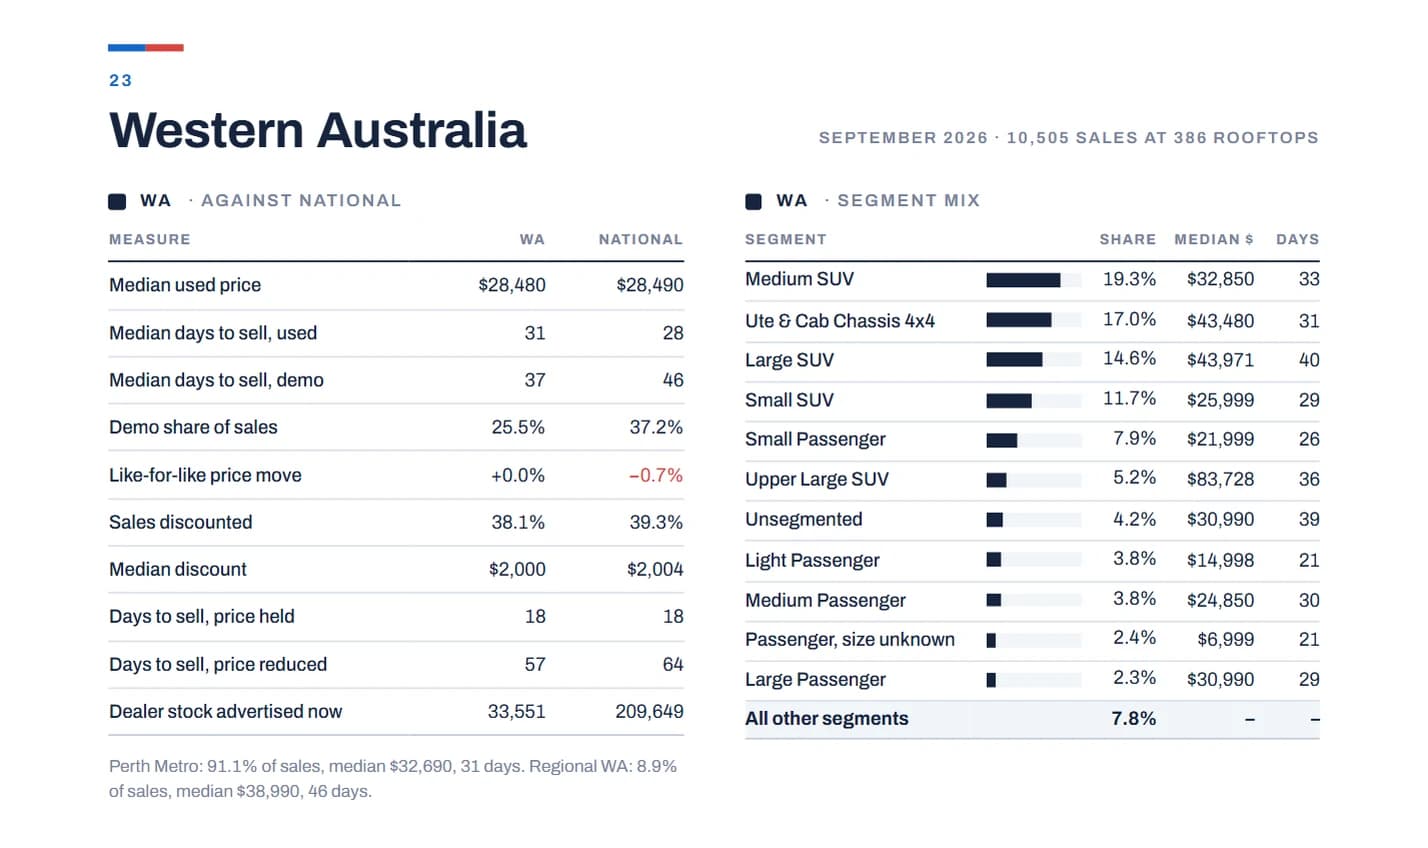
WA prices held flat like-for-like, 0.0%, while the national figure eased 0.7%. WA cut less often than the national average, 38.1% of sales against 39.3%. In August, on the same dealers, it was 42.4% against 39.1%. When WA dealers did cut, the car went in 57 days against 64 nationally.
A used car in WA went for a median $28,480 against $28,490 nationally, and took 31 days against 28. WA's demo stock moved faster: 37 days against 46 nationally.
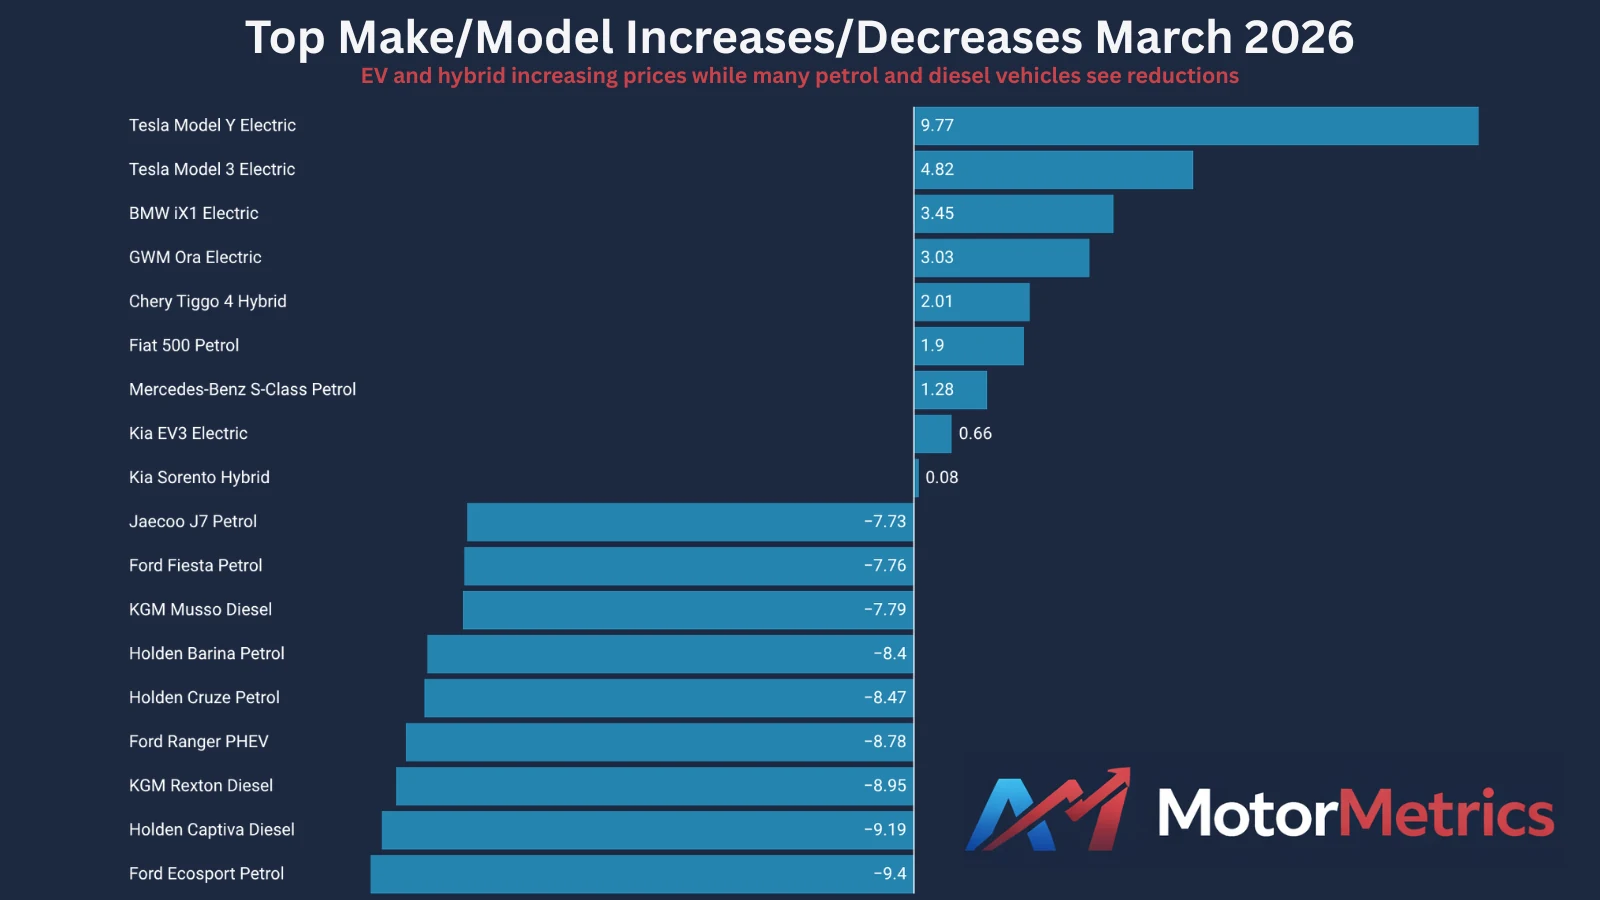
The quickest seller in the state was the MG4 EV Urban at 16 days, with the Chery Tiggo 4 at 17. The slowest was the Tesla Model Y at 95.
Supply
New listings ran around 20,000 a week nationally through September, and 209,649 vehicles were advertised across monitored dealers on 1 October, new and demo included. More than a third of the SUVs and four in ten of the utes on lots had been advertised for over 90 days, counted from when we first saw them.
The takeaway
Prices fell more slowly than in August and discounting held steady. Cars that sold at their first price went in under three weeks; cars that were cut took two months.
Figures from the Australian Dealer Market Report, September 2026. Advertised stock at Australian dealers, monitored continuously; a withdrawal counts as a sale unless the car is seen advertised again. Medians throughout.