Data and method
How the numbers are made
Where our data comes from, how a value is built, and how we check it. Written for anyone who wants to check our working, and every figure on this page comes from our own database.
Where the data comes from
We monitor the advertised stock on 3,721 Australian dealership websites every day. We also collect private listings and the Pickles and Manheim auction catalogues. Those feed Sourcing and Auctions; they don’t set any price.
Dealer websites
3,721 dealerships, national
- Used to price?
- Yes
Private listings
Western Australia today
- Used to price?
- No. Valued against the dealer market
Auctions
Pickles and Manheim catalogues
- Used to price?
- No. Valued against the dealer market
Counts as at 27 September 2026.
Why only dealer cars set the price
Our customers are dealers, so the value we give a car is a dealer retail value: what a dealer can ask for it and sell it for. That value is built only from what dealers are asking and what dealers have sold.
Private sales and auction results run at different prices for good reasons. A private seller hasn’t reconditioned the car or given a warranty, and an auction hammer is a wholesale price. Mixing them in would pull the value away from what a dealer can actually get. So we value private listings and auction lots against the dealer market, which is what makes the margin on a Sourcing card or an auction bid meaningful, but they never feed the curve.
One car, one record
Every listing is matched to a standard catalogue of makes, models, series and variants, so the same car reads the same way whichever site lists it. Where a car carries a 17-character VIN, the VIN is its identity: 96.2% of live dealer stock is identified by VIN, and stock is placed to the individual dealership rooftop that holds it, not just the dealer group.
Where an ad leaves a detail out and the catalogue says the variant only came one way, we fill it in from the catalogue and mark it as implied. We never overwrite what an ad states.
How a sale is recorded
A sale is recorded when a car is withdrawn from advertising after a period on the market. This is the delisting method the established market reports use. We check each one against the car’s price history, and relists and moves between dealers are taken back out. 485,000+ dealer sales have been recorded since 1 March 2026.
Prices are the advertised price. Drive-away prices are converted to an excluding-government-charges basis, so every car sits on the same footing. We’ve kept more than 4 million price observations since May 2026, so most sold cars carry their full asking-price history.
How a value is made
Find the cohort.
Dealer cars of the same make, model, year, series and fuel, sold and still listed. The engine sits on 590,000+ of these observations tonight.Draw the curve.
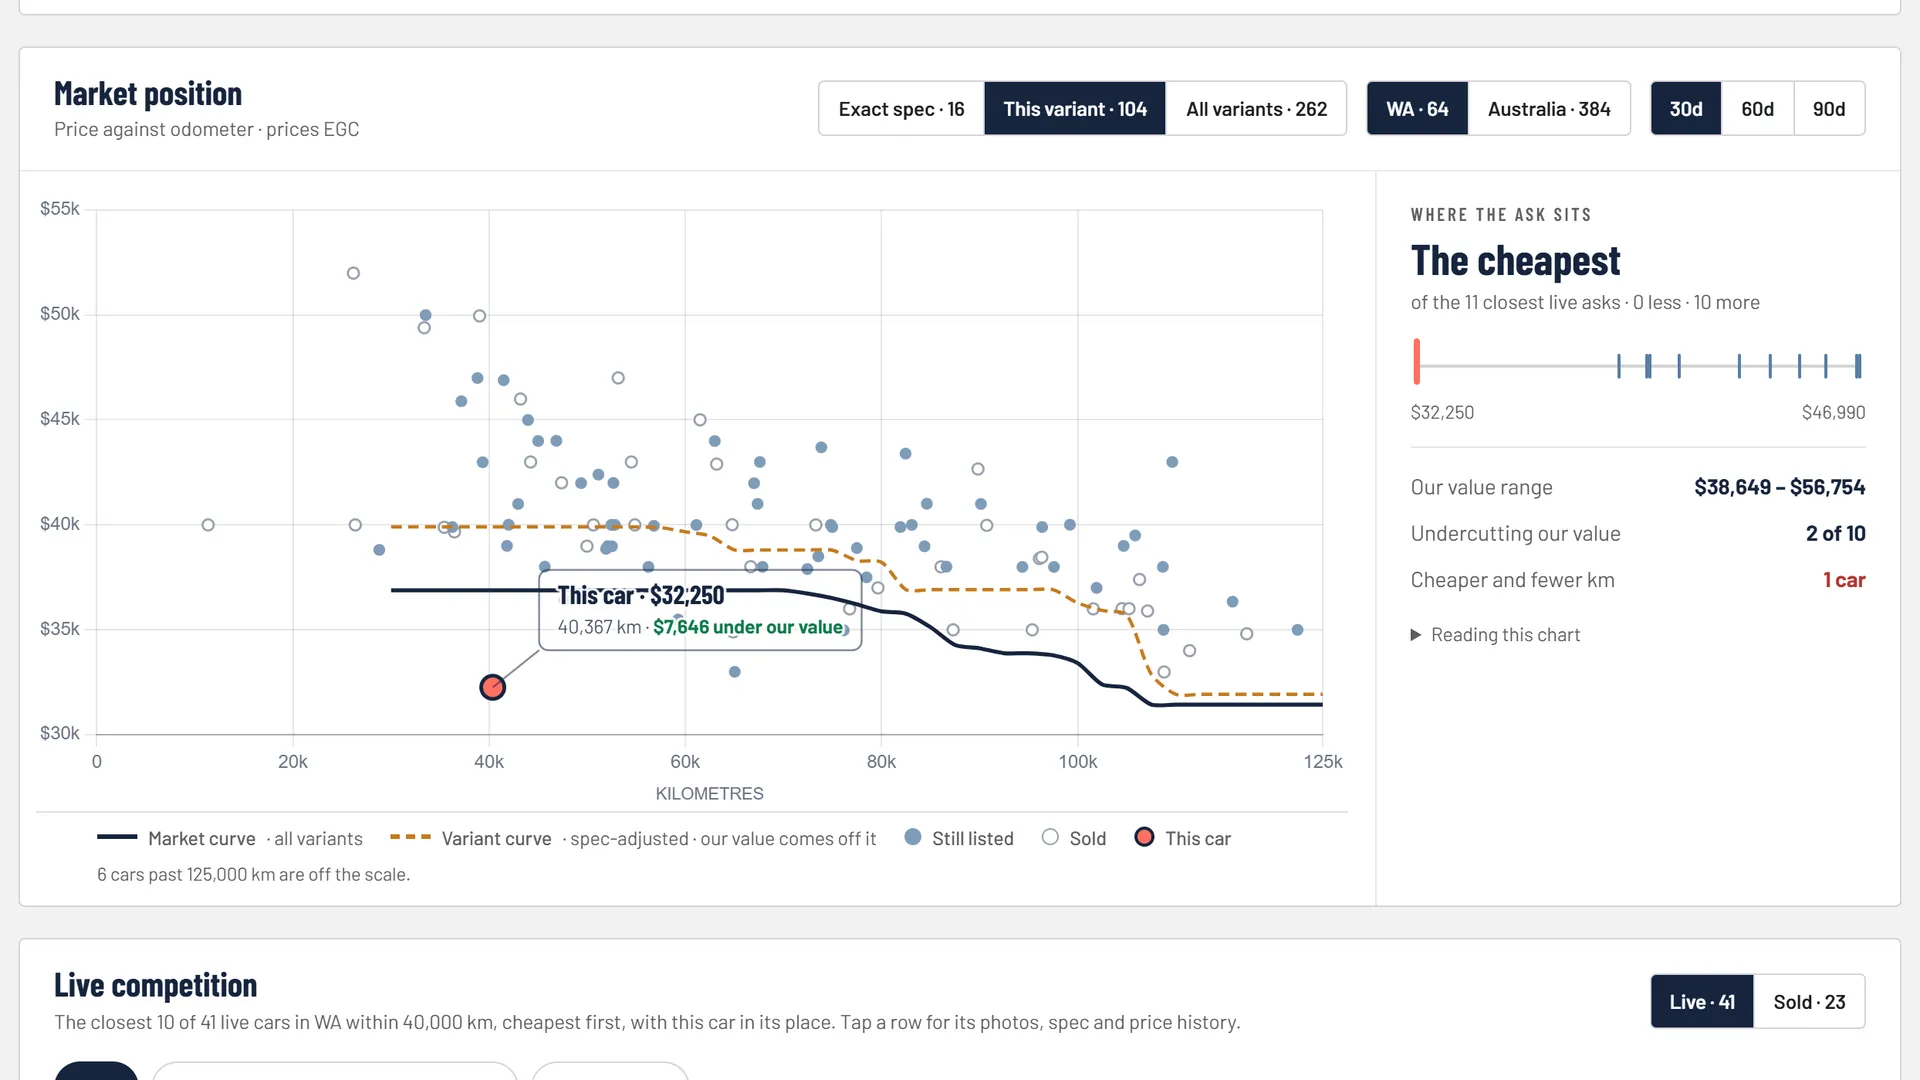
A market curve of price against kilometres through those cars, weighted towards the most recent, which never rises as the kilometres go up.Use the variant where it’s thick enough.
Where the car’s own variant has 15 or more comparable vehicles, the value comes off that variant’s own curve.Adjust for spec.
Differences like body, drive, transmission and engine are added back only where they genuinely vary in that cohort.Grade it.
Every value carries a range and a confidence grade built from how many comparables there are and how closely they match.Or say no.
With fewer than 10 comparable vehicles, the engine returns no value and says why.
How we measure it
Tested on 500 dealer cars sold 24–26 September 2026, each valued by our live engine before it had seen the sale. Cars are ones where we know the exact model variant. Error is the difference from the last price each car was advertised at before it sold. We use four measures, because a median alone hides the misses.
| Measure | Before the engine saw the sales | After it had |
|---|---|---|
| Coverage (cars given a value) | 98.6% | 98.6% |
| Median error | 4.2% | 3.6% |
| 90th percentile error (where the worst 10% start) | 14.3% | 12.9% |
| Within 10% | 79.9% | 83.4% |
Testing on cars the engine hadn’t seen sell matters, because that’s how you use it: you value a car before it sells. The “after” column is what the engine does with a sale in hand. The “before” figures are the fair test of a value you’d act on, so they’re the ones we quote everywhere else. Every change to the engine is also scored on a standing set of 500 sold cars before it goes live, and each change keeps a named way back.
Accuracy rises with price. The same 500 cars, split by the last price each was advertised at:
| Price | Cars | Valued | Median error | Worst 10% from | Within 10% |
|---|---|---|---|---|---|
| Under $15,000 | 45 | 95.6% | 7.2% | 19.9% | 65.1% |
| $15,000 to $30,000 | 174 | 99.4% | 4.6% | 15.2% | 77.5% |
| $30,000 to $50,000 | 182 | 99.5% | 4.4% | 12.7% | 82.3% |
| $50,000 and over | 99 | 97.0% | 3.4% | 11.3% | 86.5% |
| All cars | 500 | 98.6% | 4.2% | 14.3% | 79.9% |
Cheaper cars are the hardest to value: a few hundred dollars is a bigger share of a $9,000 car, and older cars vary more in condition. The small groups (45 and 99 cars) move more from test to test. Cars we can’t resolve to a variant run at about twice the error, which is why every value carries a confidence grade.
When it runs
- Through the day
- Dealer websites, private listings and auction catalogues are collected.
- After midnight, Perth time
- The market evidence is rebuilt, then every dealer’s advertised stock is revalued.
- Overnight
- The wider market for Sourcing is revalued on a rolling cycle, about half of it each night, so no car’s value is more than three days old. New stock is valued the night it appears.
So what you see in the morning is last night’s market, not this minute’s.
What we don’t claim
- Sales are inferred from withdrawal, not confirmed transactions.
- Auction results are inferred from the catalogue. We don’t have hammer prices.
- Private listings cover Western Australia today, not the country.
- Values reflect the previous night’s market.
- The 4.2% figure is a median on variant-resolved cars. It isn’t a promise about any one car.
- Write-off flags on private ads come from what the seller wrote, and the salvage check covers the salvage sales we’ve seen since 27 August 2026 (17,591 VINs). Neither replaces a PPSR or written-off register search.
How we handle data
- We collect publicly advertised vehicles: the car, its price, its photos and the ad’s description.
- We don’t collect buyers’ details, and we don’t contact private sellers.
- What a dealership enters in the app, including its pricing rules, targets, notes, appraisals and customers, belongs to that dealership and isn’t shown to other dealers.
- Want a listing or its photos removed? Email hello@motormetrics.com.au and we’ll take it out.
Questions about the method? Ask us. We’d rather you asked than assumed.
See it on your own stock
Book a 30-minute demo and we’ll pull up your yard. If we already monitor your website, your cars are in the app the moment you’re approved.
Early access for dealers and data partners. We onboard by hand, and your first 14 days are free.